
You might be surprised to learn that less than two-thirds of small businesses have a website. Nowadays, simply having a functional website for your business is not enough to attract customers. So, what’s even more shocking is the small percentage of these businesses which actually take advantage of the different website optimization tools available.
One such tool is heatmap analysis. But what is heat mapping and how can it be used to develop your business’s online presence, and ultimately sales?
Keep reading for our essential guide to learning from heatmap analytics.
What Is Heat Mapping?
Let’s start with an introduction to what heatmap analytics is and why it’s crucial for your website’s success. Heatmap analysis gathers data about user journeys from the moment they arrive on your website, to the time they exit it.
When we refer to heat map analysis, this reporting tends to consist of heat maps in addition to scroll maps and click maps.
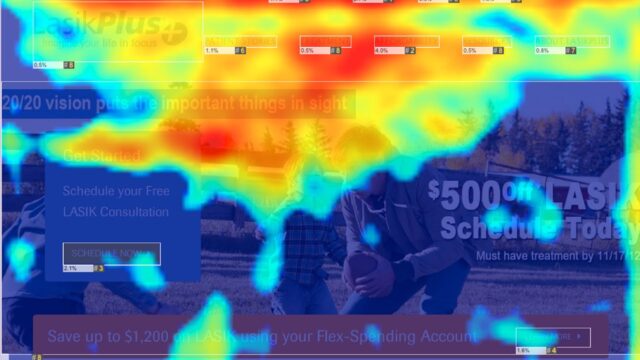
Data including time spent on each page, scrolling and clicking movements, and even where the mouse hovers are all captured by heatmaps. This information is displayed visually, using colors to show the most frequently viewed and clicked areas of your website.
Heat maps compile the user interaction and activity of thousands of visitors to your website. So, it’s possible for businesses to understand which areas of their webpages are functioning well. It’s also possible to learn, perhaps, where users lose interest or navigate away from your site.
We’ll now take a closer look at how heat mapping analysis provides a deeper understanding of your business and its digital presence.
Website Objectives
First, heat mapping analytics allow businesses to consider whether the objectives of their website are being met. Let’s say the purpose of your site is to increase brand awareness. In this case, you will want to see visitors exploring different blog articles and pages of your website.
For others, the sole purpose of their website is lead generation. Heat mapping reports will show how users interact with contact forms and other interactive elements on your site.
In this way, heat mapping verifies whether user activity corresponds with the aims of your website. Where these two considerations diverge, you can alter the design or structure of your website to encourage more desirable activity.
Check Experiences Across Device Types

Heat mapping also ensures a positive user experience of your website is by tracking activity across different device types. Nowadays, internet users are increasingly relying on phones and tablets to browse the web. Thus, it’s important that your site works well across a range of screen sizes and types.
Use heatmaps to compare the same webpages across different device types. You can also use click maps to check that your CTAs and clickable content takes the same precedence no matter which device is being used.
Heatmap analytics providers such as decibel.com stress the importance of finding out which areas of your website get the most attention. They also consider which parts lead to the most engagement. Use these insights to make sure that your most engaging content is in a prime position on your website across all devices.
Test New Designs
One of the key methods for continual website optimization is A/B testing. This allows businesses to compare two different website layouts, images, or calls to action (CTAs). They can then find out which generates better engagement from visitors.
Using heat map analytics in conjunction with your A/B testing is a great way to track user activity across different website designs. You can find out the percentage of users who clicked a button, or how far visitors tended to scroll down the homepage.
When introducing a new website layout or changing your content, be sure to conduct scroll map and click map analysis. This will make sure your site is still maintaining interest and obtaining the desired results.
Check Which Content Is Being Seen

Heat mapping allows significant user experience insights to be learned. The colors appearing in heat map and scroll map reports indicate the levels of traffics that different parts of your website have received.
A sudden change in color might indicate that people tend to stop scrolling at this point. Your site design might need to be considered as this would suggest visitors think they have reached the bottom of the page.
It’s also possible to check the average portion of your landing page that users can see without scrolling. This helps businesses to prioritize their content.
Reduce Confusion and Distraction
The last way heat maps can be used is by gaining further insights into the user experience in terms of confusion and distraction. Scroll maps are a good indication if there is a section of your website that distracts visitors from the key elements you want to direct them to.
It can also highlight areas of confusion. For example, it might show a part of your site where users expect to be able to click, but cannot because this is a non-clickable element.
Finally, heat mapping helps to provide insights for your business by highlighting areas that need attention. If a link is broken and this is causing visitors to leave your site, heat mapping analysis can signal this issue.
By fixing broken links, you will also improve the SEO of your page, helping your website’s performance in organic search engine results.
That’s How to Benefit From a Heatmap Analysis

We’ve now covered exactly how heat mapping analytics tools can help optimize your website. The knock-on effects of an efficient website cannot be understated.
Your business can look forward to more customer interaction and greater lead generation. You’ll also be able to increase the loyalty of your existing customers.
If you found this guide to heatmap analysis helpful, make sure you check out our other digital marketing articles!


